How to Create & Interpret Your Event Data Report
An insightful Q&A with Jublia’s CS team
September 18, 2025

Event organizers often find themselves swimming in dashboards and reports, but the real challenge is knowing what the numbers mean and how to act on them. Data matters now more than ever, not just to prove ROI, but also to improve attendee experiences and retain exhibitors.
To learn more, we sat down with the Jublia Customer Success (CS) team for a candid Q&A on how organizers can create and interpret their event data reports. Here’s what they shared.
Event data isn’t just a collection of numbers, it’s the narrative of your event. Reporting allows organizers to track everything from platform engagement before the event to session interest and meeting fulfillment onsite. These insights give a full picture of event performance and help organizers make data-driven decisions, whether that’s to prove ROI, fine-tune matchmaking, or adapt programming.
“Reporting is essential for event organizers because it provides insights into event performance, helping them make informed, data-driven decisions.”
But with so much information at hand, the value lies in turning complexity into clarity.
“We simplify the reporting process with a clear data-story framework. We transform complex data into a narrative, where each of the key metrics is part of a larger story of event success,” the team added.
By shifting from raw numbers to a data story, reporting becomes less about overwhelming spreadsheets and more about actionable insights that organizers can communicate to stakeholders and use to shape future strategies.
When looking at event reports, it’s tempting to zero in on easy-to-grasp numbers like attendance or pre-scheduled meetings. While these are valid indicators, stopping there can create a narrow view of success.
“Some organizers focus solely on pre-scheduled meetings as the primary indicator of platform success. While important, they don’t tell the full story. We guide them to dive deeper into other indicators like session views, total scans and heatmap analysis.”
The team also highlighted the missed opportunities that come with focusing too narrowly:
“If organizers have enabled features like Agenda, Scan and AI Maps, we encourage them to track engagement through other touch points like session views, total scans and heatmap analysis onsite as these reflect genuine interests and engagement with exhibitors or content.”
By broadening the perspective to include these other data points, organizers gain a more holistic view of engagement, leading to a richer understanding of ROI.
The truth is, not every metric needs attention all at once. Jublia’s approach is to guide organizers through a logical, story-driven progression.
“Instead of being overwhelmed by plenty of data sets and insights, we follow a logical progression: Interaction to Opportunity to Realization.”
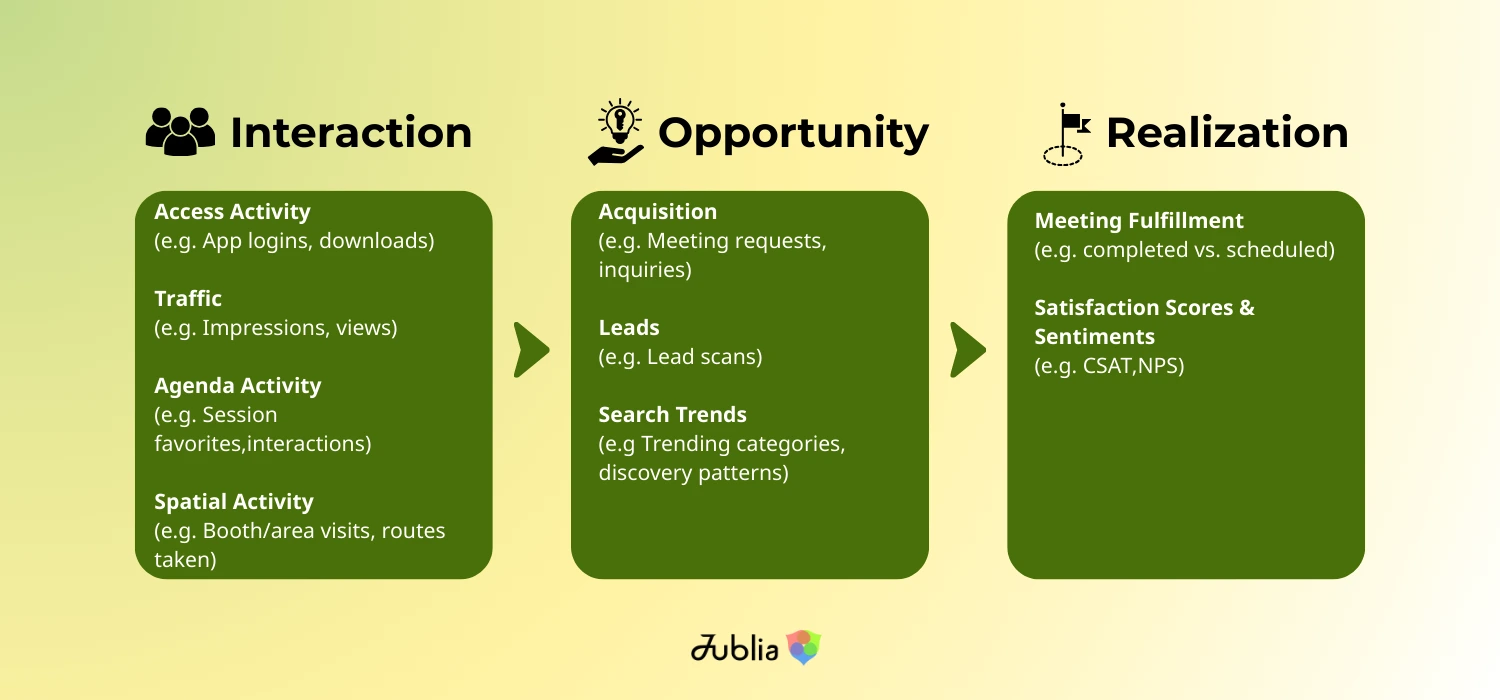
This framework helps cut through the clutter by highlighting which numbers are most relevant at each stage of the event journey.
The team added that Jublia supports organizers with clarity at every step:
“Whether they are in the pre-event, during event or post-event phase, we highlight the most relevant data, guiding them to focus on the key metrics that will drive success at each stage.”
To make it even easier, organizers receive regular updates and post-event summaries that highlight the essentials:
“We provide organizers with regular updates, along with a comprehensive event summary (HTML email) that includes key metrics such as adoption rates, access activity, agenda activity, traffic, meeting requests, total scans, total meetings, etc.”
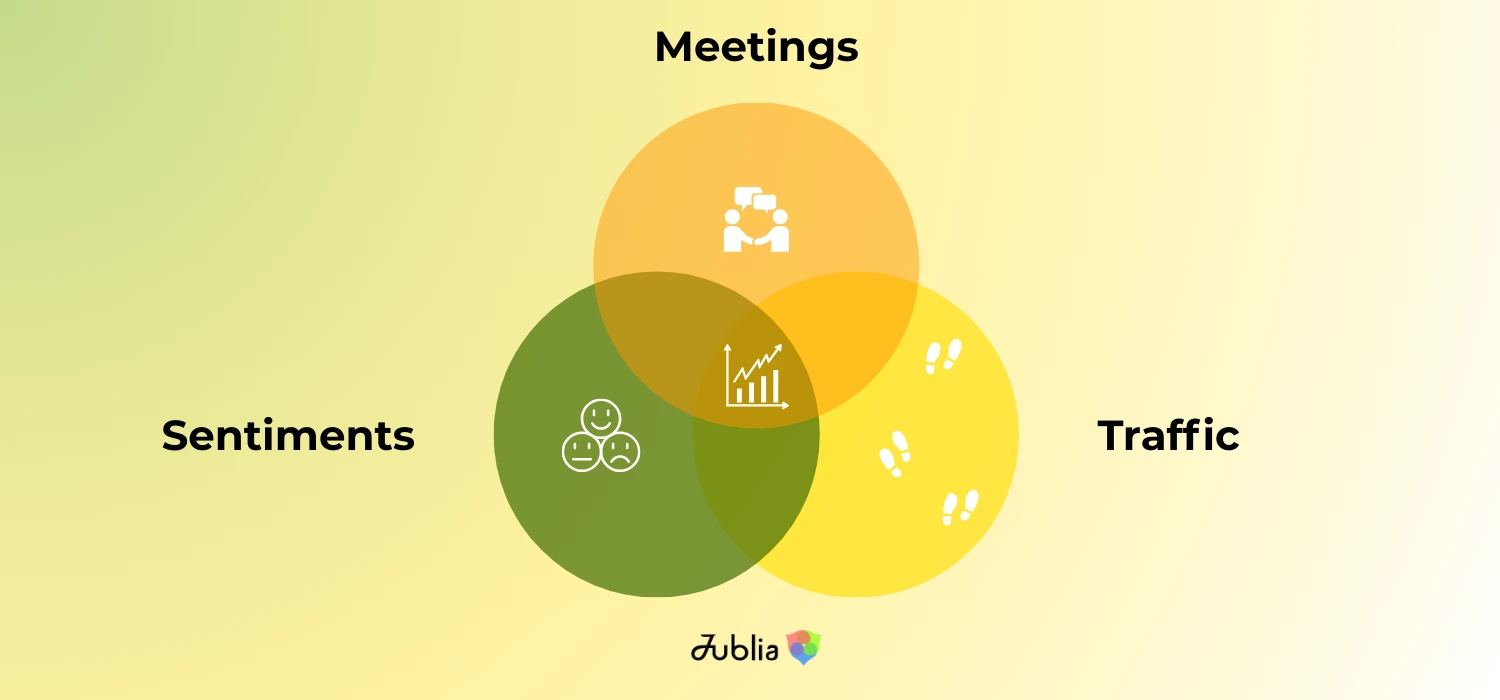
ROI can often feel like the most complex part of event reporting, especially in trade shows where exhibitors want clear evidence of value. Jublia breaks it down into a few key areas.
First, traffic:
“Traffic is a critical starting point. It helps organizers understand what aspects of their event are capturing their audience’s attention and generating interest.”
This goes beyond counting visits and includes analyzing behavior, interests and engagement patterns.
Second, meetings:
“Meeting fulfillment is another crucial metric that directly ties into ROI - not only the number of meetings prescheduled on the platform but also the number completed, their quality, and any follow-up actions.”
Beyond the numbers, these insights reveal whether the event is actually driving valuable business outcomes, like generating leads or closing sales for exhibitors. By tracking these “realization” metrics, organizers can clearly demonstrate how exhibitor participation translates into tangible business value.
Finally, sentiments:
“We provide the sentiments through NPS and CSAT scores which help organizers measure the overall satisfaction of their attendees. High satisfaction scores generally correlate with a positive event and app experience which is a key driver of ROI.”
These results also serve as a strong predictor of loyalty. When exhibitors give high ratings and positive feedback, they’re not only signaling satisfaction but also a greater likelihood of returning for future editions. In other words, strong sentiment directly supports exhibitor retention.
Together, these metrics highlight both the wins and the gaps. Data doesn’t lie, it reveals the full picture. Positive results can strengthen exhibitor confidence and drive renewals, while negative fulfillment or weak engagement can serve as a crucial reminder of where adjustments are needed. Looking at both sides helps organizers not only prove value but also uncover opportunities for growth and improvement.
“At the end of the event, we usually focus on attendee sentiments and the overall performance of the app. These insights can guide decisions on project implementation, matchmaking strategies, and more.”
By analyzing results, organizers can identify what resonated with attendees, what fell short, and where strategies need refinement.
But reporting doesn’t stop at fine-tuning for the next edition. When data is sliced and compared against broader business or industry trends, it can reveal fundamental opportunities: launching new programs or side-events, or even attracting entirely new attendee groups. This makes event reporting not only a retrospective tool but also a driver of innovation and growth.
Real-time feedback takes this process further.
“We make it easy by offering real-time feedback loops. With tools like the sentiments, organizers can pinpoint what worked and what didn’t and use that information to enhance their next show.”
Rather than waiting until after the event to course-correct, organizers can act quickly, making reporting a living, dynamic tool.
When used this way, event data stops being a backward-looking report and instead becomes both a playbook for continuous improvement and a springboard for uncovering new opportunities.
Event data can feel overwhelming at first, but with the right approach, it becomes a powerful guide for decision-making. As our CS team shared, the key is to focus on the metrics that matter most, interpret them in context, and use those insights to create more meaningful event experiences.
“High satisfaction scores generally correlate with a positive event and app experience, which is a key driver of ROI and future retention.”
At its core, reporting is about clarity. The numbers and dashboards are only valuable when they tell a story that organizers can act on, whether that means proving ROI to stakeholders, identifying gaps in engagement, or shaping a more personalized experience for attendees. With a clear data-story framework, real-time feedback loops, and post-event summaries that highlight the essentials, reporting becomes less about spreadsheets and more about unlocking opportunities for growth, as we’ve seen firsthand in our recent success stories.
Event success is built on insights, and insights start with reporting.
Want to see how this works in practice? Talk to our Solution Specialists or follow us on LinkedIn for more event strategies and updates.

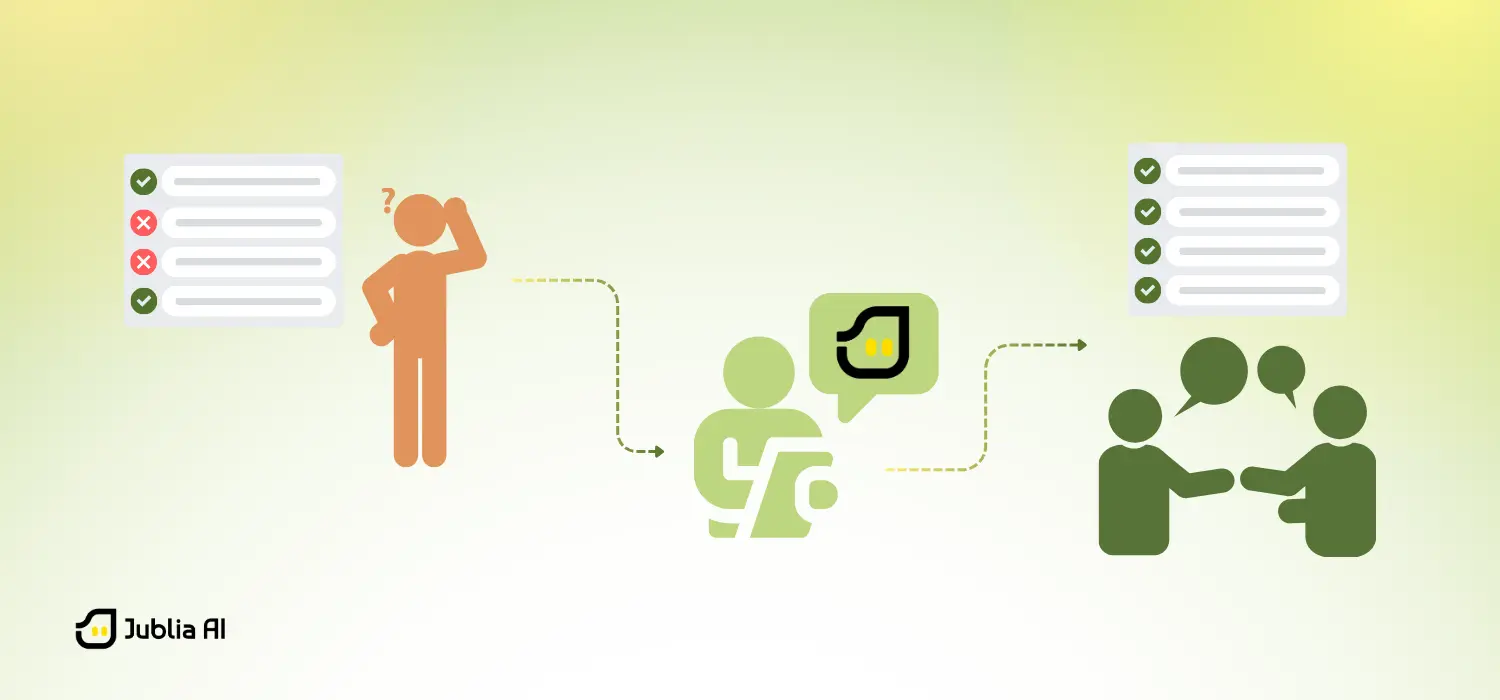 The Communication Engine: Orchestrating Event Engagement with Jublia AI’s Concierge Delivery
Engagement doesn’t happen on its own — it’s designed
 The Event Experience Gap: How to Design Events That Attendees Actually Want
Organizers expect events to give value. Attendees do too, but a different one.


.gif)
%201.png)
%201.png)
%201.png)
--p-2000.webp)
%20Black-Black%20Eyes.gif)